- EWG scientists refined the ranking methodology for this year’s Shopper’s Guide to Pesticides in Produce™
- The 2025 rankings of fruit and vegetables consider pesticide toxicity, in addition to abundance, diversity and intensity.
- The methodological updates this year change the rankings only slightly, compared to previous updates.
Background
EWG’s Shopper’s Guide to Pesticides in Produce™ ranks popular fresh fruits and vegetables based on levels of pesticide contamination and toxicity. EWG has released the Shopper’s Guide nearly every year since 2004.
To create the guide, EWG analyzes pesticide residue data for tens of thousands of samples collected by the Department of Agriculture as part of the Pesticide Data Program, or PDP. EWG then adds pesticide toxicity information published by government agencies and peer-reviewed research.
How the changes affect the relevance of earlier Shopper’s Guide lists
While there is some reshuffling of the rankings in this year’s guide, the main takeaway from the updated methodology analysis is that the listings are similar to previous years.
Though the lists might be very similar, the underlying data is more comprehensive and robust this year, with the removal of correlated metrics and the consideration of toxicity.
How the methodology has changed
The updated methodology includes four metrics– preserving three of the original metrics unchanged from prior years, plus adding a fourth to account for overall pesticide toxicity.
These metrics assess:
- Percent of samples tested with at least one pesticide detected.
- Average number of individual pesticides detected on a single sample.
- Average total concentration of pesticides found on a single sample.
- Overall toxicity of pesticides on a crop.
Each of these now represents a unique but relevant aspect of pesticide levels on produce: abundance, diversity, intensity and toxicity, respectively.
For each metric, we ranked the 47 fruits and vegetables by the raw values and then normalized the ranks on a scale of 1 to 100, with 100 being the highest. These ranks were then summed into a final overall score for each type of produce and ranked from highest to lowest.
Why EWG changed the methodology
In previous years, EWG used six metrics of pesticide contamination in produce to rank fruits and vegetables, weighting each metric equally.
EWG experts reviewed the methodology to determine metrics of pesticide contamination that were most relevant for human health and best reflected the ways consumers may be exposed to pesticide residues through food.
For each crop, this includes the likelihood of exposure, based on the number of samples with detections, the number of pesticides a consumer may be exposed to, the overall level of exposure, and the toxicity of the pesticides.
A few of the metrics in the original Shopper’s Guide ranking methodology were highly correlated, essentially capturing similar information.
For example, the first two metrics considered in the old Shopper’s Guide methodology measured the percent of samples tested with any detectable pesticides and the percent of samples with two or more detectable pesticides. These metrics have health relevance, given that mixtures of pesticides can increase risk of health harms, even at low concentrations.
But the 2025 Shopper’s Guide data show that on any individual crop, very few samples had the residue of just one pesticide. Two or more pesticides were detected, on average, on nearly 90% of Dirty Dozen™ samples – the list of produce with the most pesticide contamination.
So, when EWG measured the presence of one or more pesticides on a sample separately, it duplicated a single measure.
To develop a streamlined combined metric, we first compared how all six of the original metrics stacked up against one another through a correlation matrix, in which higher coefficient values reflect a higher degree of correlation between a given pair of variables.
Correlations were calculated using a measure of the strength and direction of association between two ranked variables, known as Spearman’s rank correlation coefficient. (See Figure 1.)
Figure 1. Previous Shopper’s Guide metrics were highly correlated with one another.
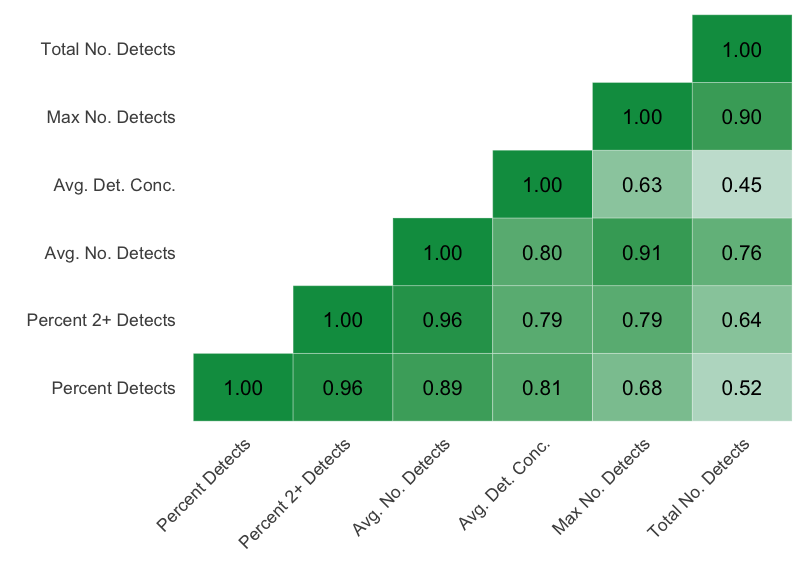
Source: USDA PDP Data, 2000-2023
EWG found that several pairs of metrics were highly correlated, with six and four metric pairs having Spearman correlation coefficient values exceeding 0.8 and 0.9, respectively. This means that many of these metrics were repeating the information captured by other metrics.
The current iteration of four metrics still has correlated values, but the calculation of the metrics themselves are unique.
How EWG calculated overall toxicity
The toxicity of pesticides is determined by comparing the concentration of a pesticide detected to a value that measures the toxicity of that pesticide, or a pesticide-toxicity ratio.
First, for each produce type, EWG summed all concentrations for each pesticide (including metabolites and degradates of that pesticide) across all samples. Next, pesticide-toxicity ratio values were calculated by dividing the average summed concentration values by a toxicity reference value for the parent pesticide. This approach was informed by peer-reviewed studies.
Pesticide regulatory agencies like the Environmental Protection Agency and the European Food Safety Authority define toxicity reference values for pesticides, called reference doses or acceptable daily intakes. Regulatory authorities in other countries and regions may set different toxicity reference values, based on their framework of risk assessment.
These reference values may change over time, depending on data availability, agency policies or approaches to risk assessment. These values are based on exposure doses used in animal studies typically conducted by pesticide manufacturers.
In addition, independent scientists evaluate the toxicity of pesticides, usually in animal studies but also in humans who have been exposed to pesticides. Toxicity reference values can be derived using these data. Often these lead to lower, or more health protective, levels of exposure.
This was the case for chlorpyrifos, an insecticide that can harm the developing brain. When toxicity reference values derived from human studies, the safe levels of exposure were far lower than when animal data were used to derive values.
For the overall toxicity metric, EWG primarily included the NOAELs, or no-observed-adverse-effect-level, used by the EPA when it reviews toxicity information for each pesticide registered for use in the U.S. The NOAELs provide a consistent source for pesticide toxicological reference values.
New, refined methodology’s effect on the rankings
The updated methodology changes the Shopper’s Guide rankings only slightly for most fruits and vegetables.
Since EWG added one new benchmark for pesticide toxicity, and effectively condensed the other five into three representative metrics, the rankings change very little, if at all, shifting by an average of just two positions.
Notably, most of the rank shifts did not result in various types of produce entering or falling out of the Dirty Dozen list or Clean Fifteen™ – the list of items with the least pesticide contamination. The order of the fruit and vegetables within each list changed, but which fruits and vegetables populate each list mostly did not change.
But potatoes, broccoli and tomatoes ranked differently using the new methodology. In the new rankings, bell and hot peppers drop out of the Dirty Dozen and potatoes join the list.
The Clean Fifteen remains largely unchanged, with sweet potatoes falling off and cauliflower joining the list.
The plot below compares the two methodologies. (See Figure 2.) It compares how each type of fruit and vegetable would have ranked according to the old methodology with how they rank in the 2025 Shopper’s Guide, using the refined methodology. For most crops, the vertical distance between blue and pink dots is small, which suggests minimal change from one methodology to the other.
Figure 2. Rankings change only minimally from the new, refined methodology.
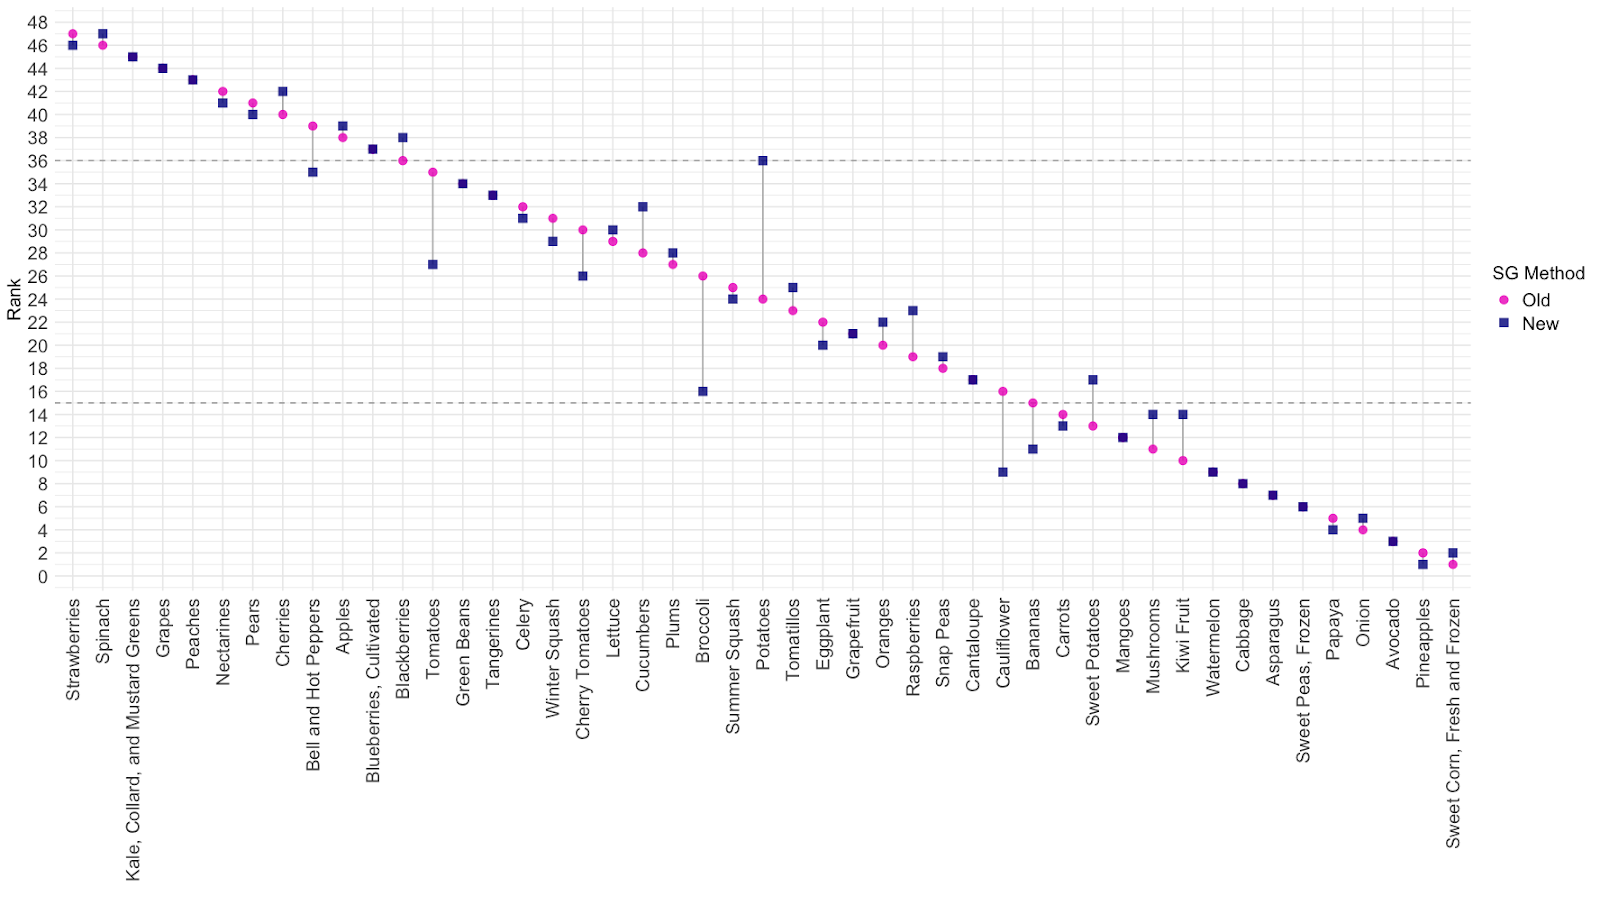
Source: USDA PDP Data, 2000-2023
A snapshot of pesticide contamination on all crops illustrates how the new methodology can affect rankings.
The dotplot below shows there are many pesticides on the fruits and vegetables we eat. (See Figure 3.) But the high number of pesticides is only part of the story. Pesticides also vary significantly by type and concentration, represented by the color and size of the dots respectively.
Figure 3. There are more pesticides of different types and in higher concentrations on Dirty Dozen compared to Clean Fifteen produce.
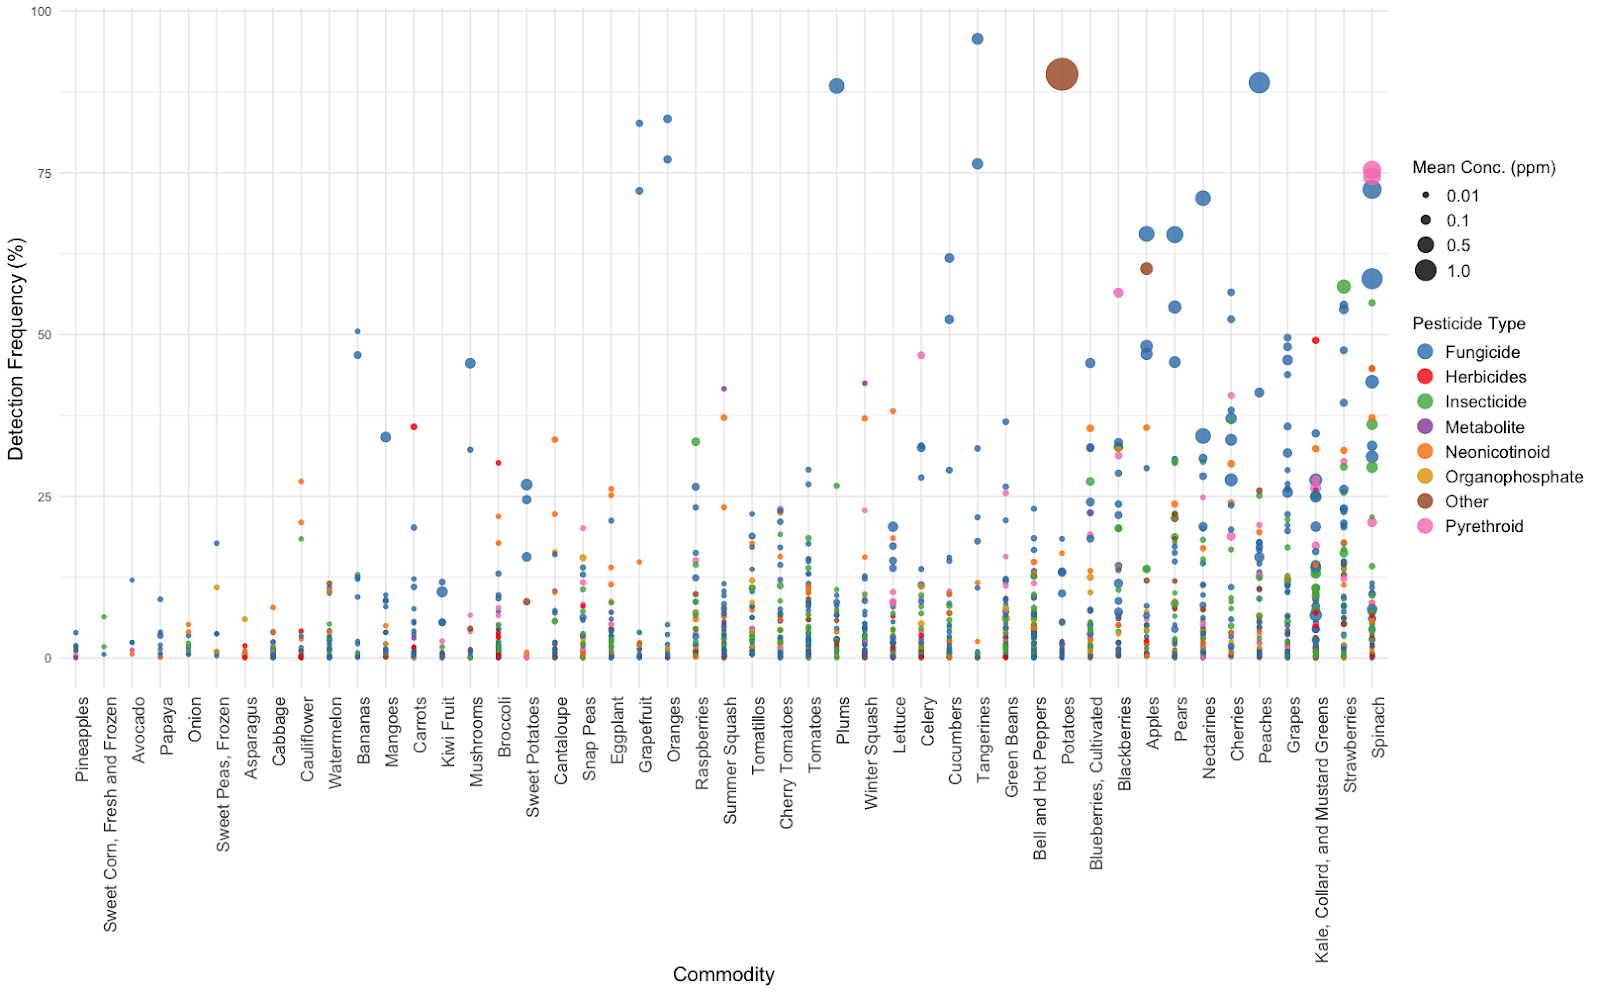
Source: USDA PDP Data, 2000-2023
Note: Neonicotinoids, pyrethroids and organophosphates are insecticides; coloring of pesticide type has been separated for more granularity in pesticide type.
Not as many pesticides are detected on potatoes as on crops like spinach and strawberries, which is why in the past they have appeared in the middle of the list, neither in the Dirty Dozen nor Clean Fifteen.
The large brown dot in Figure 3 for potatoes represents chlorpropham, a plant growth regulator that was detected at a high average concentration. It has been found to pose health risks to agricultural workers and consumers in Europe.
All pesticides were previously treated equally, so the methodology didn’t consider the high concentration of chlorpropham relative to the concentration that may cause harm.
EWG’s updated methodology considers differences in pesticide toxicity, among other factors, which can result in certain fruits and vegetables ranking differently now than in previous iterations of the guide. Potatoes are an example of this difference.